

Deep Dive: Copart ($CPRT)
The Online Auction Behind Every Totaled Car In America

This is our first ever company deep-dive we have published on Substack without a paywall.
Free to read. Dive in!
From Junk to Gold
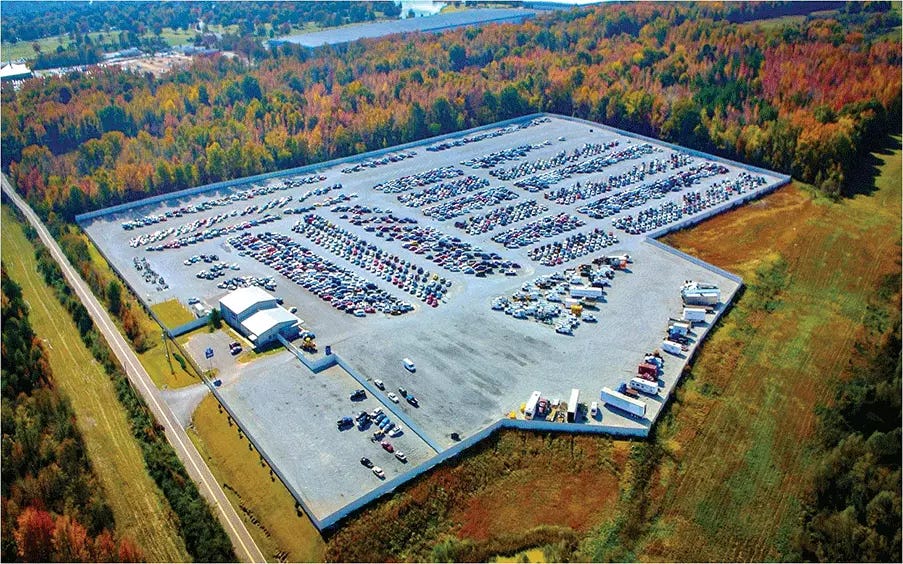
A tow truck pulls into a lot somewhere in Texas. The vehicle on its bed is a Toyota Camry that hit a center divider last Tuesday. The driver walked away. The insurer adjuster looked at the photos and at the estimate from the body shop and decided the math no longer worked.
The car is no longer a car. It is salvage. By the end of the week, the Camry will have a listing on a website, photographs taken from twelve angles, and a starting bid from a body shop in Lagos. Whether anyone in Texas ever sees the vehicle again is now an open question.
This sequence happens in roughly the same way to millions of vehicles every year in America. Two companies operate the infrastructure that moves the vehicle from the tow yard to the body shop in Lagos. The dominant one is Copart. It does not own the Camry. It does not repair the Camry. It does not ship the Camry to Lagos.
It owns the land the Camry sits on while paperwork clears, the website the body shop bids on, the relationship with the insurer that flagged the vehicle, and the integration with the tow company that brought it in. Every step of the process generates a fee, and every fee lands in the same account.
That account belongs to a publicly traded company most retail investors have never thought about. Copart trades on Nasdaq under the ticker CPRT. It has done so since 1994. Founder Willis Johnson is still chairman of the board.
The current CEO joined the company nearly a decade ago and has been in the corner office since April 2024. The single most important strategic decision the company has made in three decades was made in 2003, when Johnson killed the live in-person auctions that had been the industry’s only operating model since the 1950s. The industry told him it was too early. Twenty-three years later, we know it was the right call by a margin most companies never see.
The stock has compounded with the operating story. From a split-adjusted $13.16 in October 2018 to today’s $33.05, Copart shareholders have earned a 151% return that has survived a global pandemic, the fastest rate-hike cycle in 40 years, and two market drawdowns over 20%. The past twelve months, though, have been the worst operating patch of the past decade. US market share is contracting for the first time since the 2003 pivot. Q2 fiscal 2026 revenue printed down 3.6%. Q3 results drop today after the close. The question this deep dive answers is not whether Copart has a bad quarter. It is whether the structural advantage that produced the 151% return is still intact.
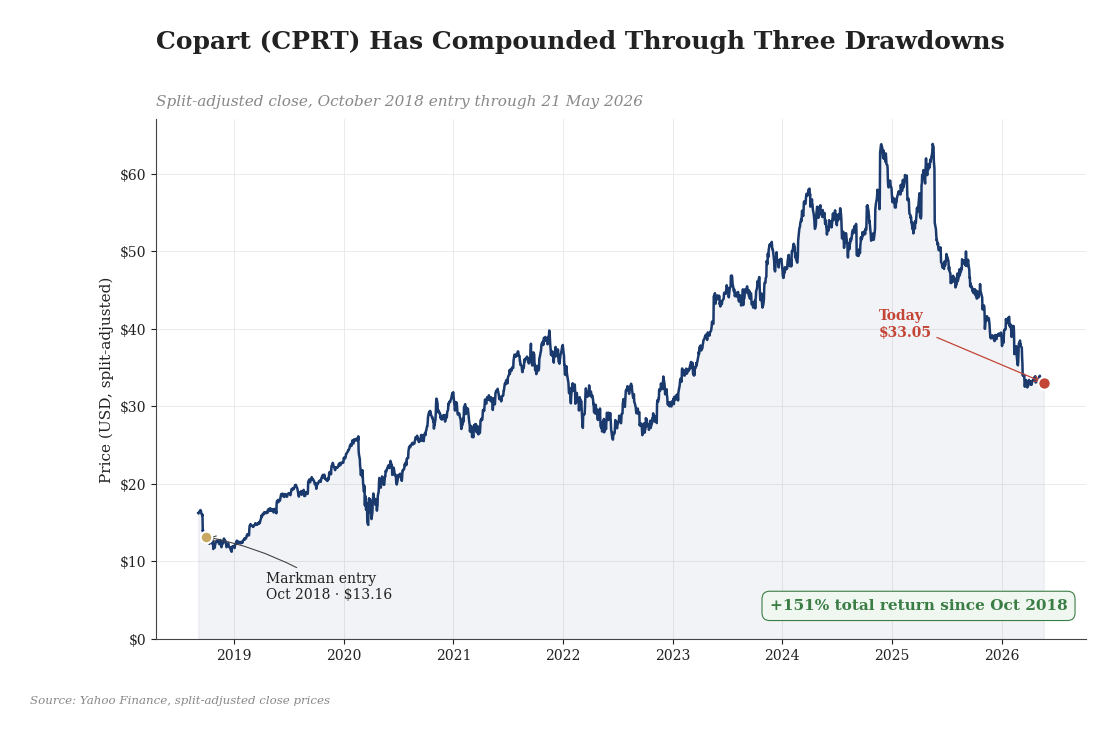
[CPRT stock price chart, 2018 entry through May 2026, with the October 2018 entry, the two 2:1 splits (Nov 2022, Aug 2023), the fiscal 2025 high, and the current $33.05 level]
Table Of Contents
A Bit Of History: The Day Willis Johnson Killed The Auctions
The Business Model: Four Fees Per Vehicle, Four Million Vehicles A Year
The Moat: Four Layers Of Twenty-Three Years
The Numbers: A Record Year And A Difficult Quarter
Management: The Founder Is Still On The Board
The Catalyst: Why Every Smart Car Becomes Copart’s Inventory
Killing The Thesis: Six Ways Copart Loses
Conclusion: The Quiet Business That Owns The Dirt
A Bit Of History: The Day Willis Johnson Killed The Auctions
In 2003, Willis Johnson killed the live in-person auctions that had been the industry’s only operating model since the 1950s. He moved 100% of the company’s volume to a virtual bidding platform built in-house. The pivot happened at a time when most consumers were still on dial-up and most enterprise software shipped on CDs. Industry analysts called the move premature. The salvage auction operators that had survived the consolidation of the 1990s scrambled to figure out whether to follow.
Within eighteen months, the platform was processing more vehicles than any in-person operator in North America. Within five years, the live-auction model was extinct. IAA, Manheim’s salvage arm, and the regional operators that survived the transition copied the playbook as fast as they could. None of them caught up on the operational footprint Copart built during the head-start window: the owned yards, the integrated tow operations, the insurer relationships, the bidder base.
Twenty-three years later, that head start is the entire business. Every totaled car in America that goes through an organized auction passes through one of two companies, Copart or RB Global / IAA. Copart processes roughly 4 million vehicles per year across 200-plus locations in eleven countries. 750,000 registered buyers across 190 countries bid on its VB3 platform. Every major US auto insurer has built claims-processing workflows around Copart’s API at a depth measured in decades. Every fee in the auction stack (tow, storage, processing, commission) is collected on every vehicle that moves through the network.
That structural position is what produced the 151% return since 2018. It is also what is being tested right now.
The Business Model: Four Fees Per Vehicle, Four Million Vehicles A Year
Copart operates the largest online vehicle auction platform in the world. The model is purely transactional. Insurance companies, fleet operators, and dealers send their totaled and surplus vehicles to Copart. Copart processes them and auctions them to a global buyer network. Fees are collected at every step.
A vehicle arrives at a Copart yard via tow truck, typically Copart’s own. It sits in storage for an average of 60 to 90 days while title processing, repair appraisal, and insurer documentation complete. Copart photographs the vehicle for the online listing, lists it on VB3, and runs the auction. Bidders from 190 countries place real-time bids. Once sold, Copart collects a sale commission from the seller, usually the insurer, plus a separate buyer fee from the winning bidder. Tow, storage, processing, commission.
Four fees per vehicle, on roughly 4 million vehicles a year.
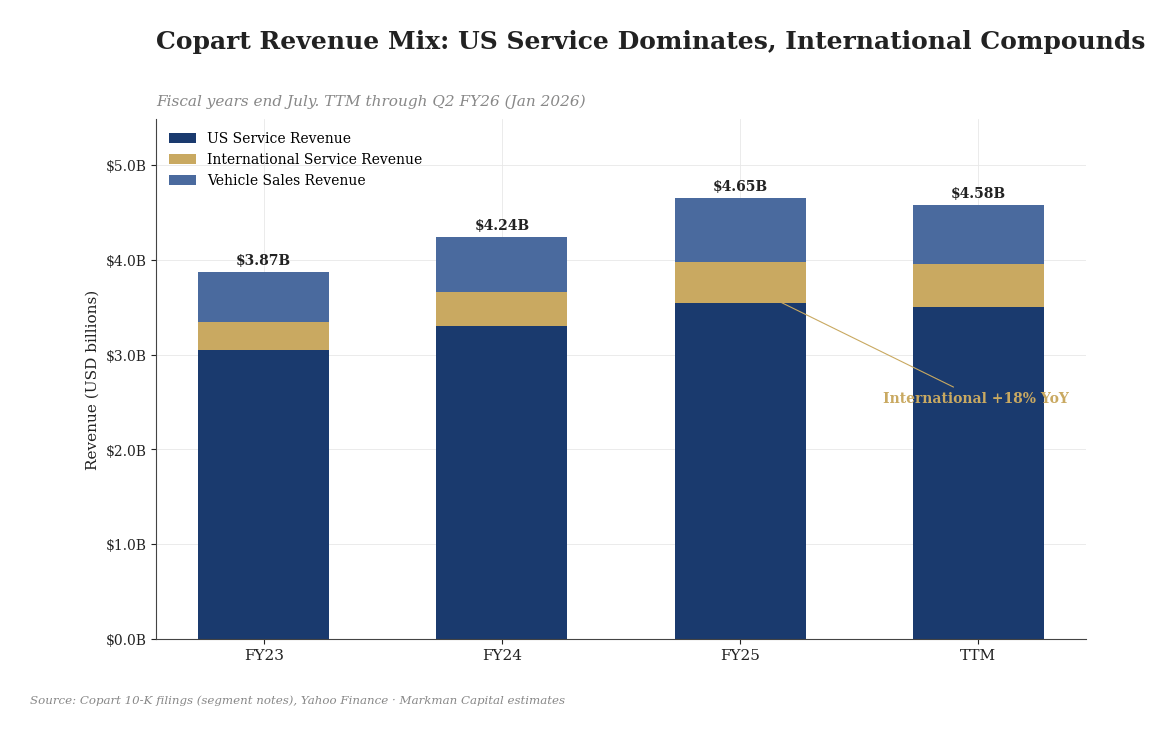
The salvage auction industry sits at an unusual position in the US economy. It is the connective tissue between auto insurers (the largest source of claim-driven total losses), the rebuilder and parts ecosystem (the largest source of demand for older damaged vehicles), and the international exporters (who buy at scale for re-sale in markets where labor for repair is cheaper than US labor). The total economic activity flowing through the network is meaningfully larger than the revenue either Copart or RB Global captures. Copart’s fiscal 2025 revenue of $4.65 billion represents a small fraction of the gross transaction value flowing through its yards.
That structural position is what makes the business worth understanding. It is also why the moat is harder to dislodge than a typical software or service business.
The Moat: Four Layers Of Twenty-Three Years
The standard deep-dive question is “what stops a competitor from doing this.” For Copart the answer is not one thing. It is four things, layered on top of each other, that took twenty-three years to build.
[Online Car Auctions - Copart Lyman MAINE]
[Online Car Auctions - Copart TN - Memphis]
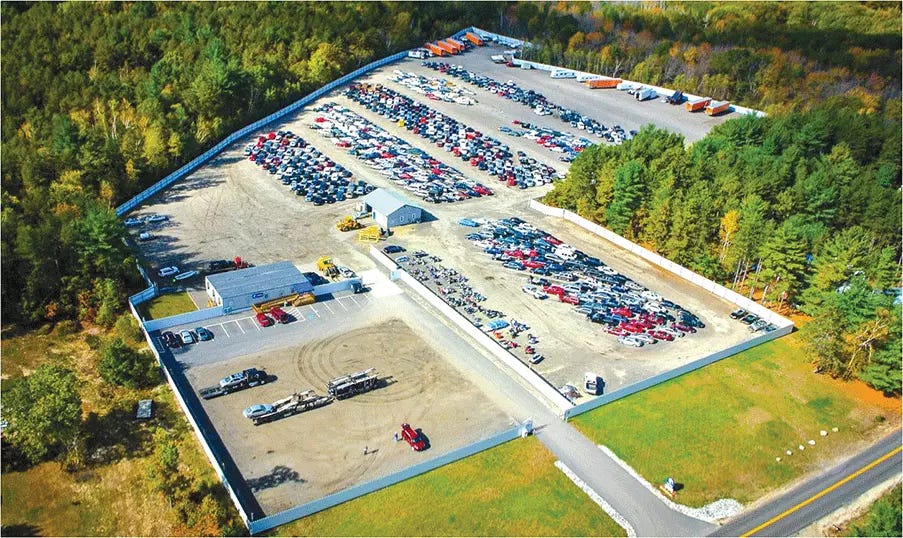
Layer One: The Dirt
Copart owns the land its 200-plus yards sit on across the United States, the United Kingdom, Germany, Spain, the Middle East, Brazil, and other markets. Owned real estate matters in a business where vehicles can sit on the lot for months awaiting title clearance. Every competitor that has tried to build a salvage network on leased property has discovered that the economics do not work at scale. Leasing works for a regional operator processing tens of thousands of vehicles. It collapses at the millions-of-vehicles level, because the per-vehicle storage cost on leased land at current commercial real-estate prices exceeds the per-vehicle fee revenue.
A competitor that wanted to replicate Copart’s footprint today would need to acquire or develop the equivalent acreage in every meaningful US metro plus the international markets, at current real-estate prices. The capital required runs into the tens of billions. None of the well-capitalized companies that could theoretically write that check (auto manufacturers, large insurers, private equity) have shown any interest in doing so over the past decade. The economics do not justify the entry.
Layer Two: The Pipeline
The largest US auto insurers have built their internal total-loss workflows around Copart’s API. When a vehicle is declared a total loss inside an insurer’s claims system, that decision triggers a workflow that pulls Copart’s VIN-decoded valuation, schedules a Copart tow, books a yard slot, and submits documentation through a Copart-hosted portal.
Migrating that workflow to a competitor is not a procurement decision. It is an enterprise IT project that takes 18 to 36 months and disrupts hundreds of thousands of monthly claims while the new pipeline gets tested. Most insurers conclude that the risk of disruption outweighs the savings of negotiating a marginally better fee structure with the alternative. The integration was built years ago, has not changed materially since, and runs every business day without anyone at the insurer thinking about it.
The recent reports that Progressive has begun shifting volume to RB Global is the relevant counter-example. The largest insurers can migrate workflows if they decide to. But the math of the migration (18-to-36-month implementation timelines, hundreds of thousands of claims at risk, IT project budgets in the tens of millions) means the switching cost is high enough to keep the rest of the customer base in place. Progressive is the exception that demonstrates the rule, not the model that gets replicated easily.
Layer Three: The Buyer Pool
The VB3 platform has 750,000 registered buyers across 190 countries: body shops, rebuilders, exporters, parts wholesalers, individual auto enthusiasts. Buyers deposit an annual access fee, link banking information, and build a bid history that establishes credit limits and access to higher-value inventory.
The network effect on the buyer side is what makes Copart’s auction prices durably higher than IAA’s, which is in turn why insurers keep routing volume through Copart even when they explore alternatives. More buyers means more competing bids means higher auction prices means more revenue per vehicle for the insurer. The buyer base took twenty-three years to assemble. A competitor that wanted to match it would need to attract 750,000 buyers to a new platform with no inventory advantage to offer them. The chicken-and-egg problem has prevented every new entrant from getting traction.
Layer Four: The Code
VB3 processes hundreds of thousands of bids per auction window, integrates with insurer claims systems through the API stack mentioned above, and supports a buyer-side mobile experience that runs in dozens of languages.
The technology lead does not show up cleanly in a competitor analysis because the competitor has shipped a feature-equivalent platform. The lead shows up in the operational scar tissue: the integrations that have been debugged for two decades, the bid-fraud detection that has been tuned against twenty-three years of attempted gaming, the auctioneer-pricing algorithms that have been trained on every salvage transaction since 2003.
CEO Jeff Liaw discussed AI integration into vehicle valuation and damage assessment as an ongoing investment area on the Q2 fiscal 2026 earnings call. That is the next leg of the technology lead. It will compound from a starting position no competitor can match.
The Share Picture: Copart Is Slipping, And Only To RB Global
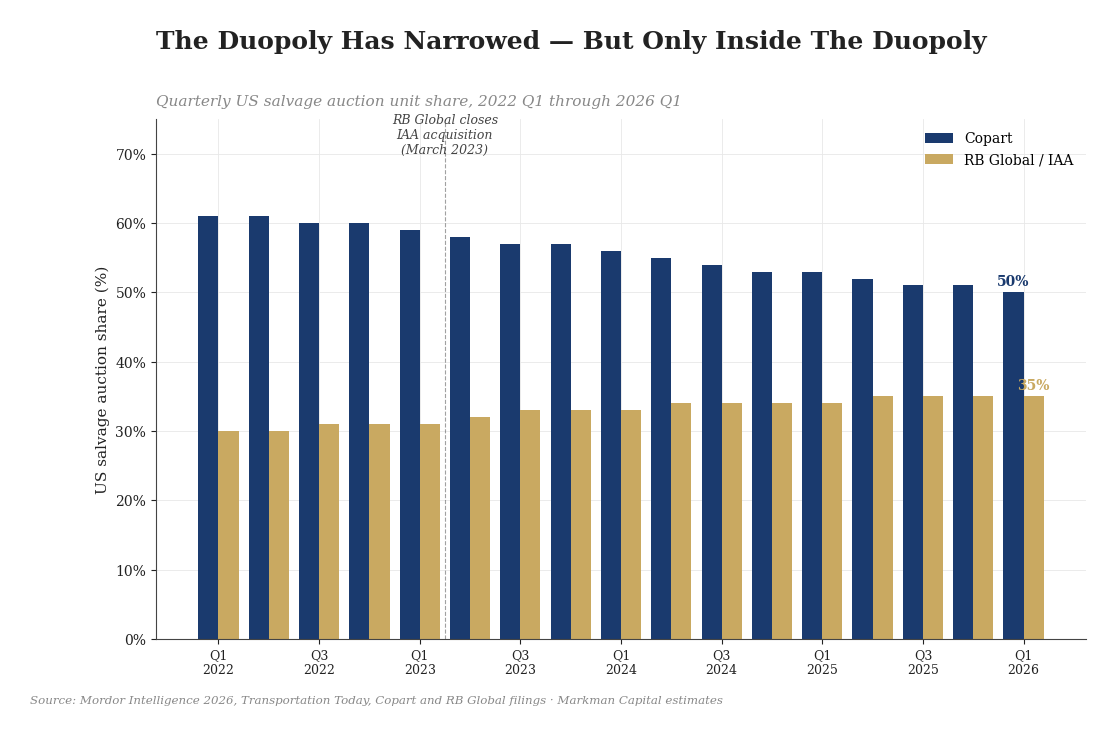
Copart is losing US market share for the first time since the 2003 virtual-auction pivot. Last quarter, RB Global / IAA grew units 4.7% year-over-year. Copart contracted 2.8%. Industry reporting has named Progressive as having moved meaningful insurance salvage volume from Copart to RB Global as part of a multi-carrier strategy. Copart now holds roughly 50% of US salvage auction share. RB Global / IAA holds roughly 35%.
[US salvage market share, Copart vs. RB Global / IAA, 2022-2026. Quarterly bars showing the recent share narrowing.]
What Copart is losing, RB Global is gaining. The share moved inside the duopoly. No third operator is in the picture at meaningful scale. No insurer has stood up an in-house alternative. No private equity rollup has consolidated the regional operators into a credible third option. A 15-point gap between the #1 and #2 player in a structurally growing market is still category dominance for the leader.
The four moat layers above (the dirt, the pipeline, the buyer pool, the code) are not eroded by RB Global taking some volume at the margin. RB Global gaining share is not the same as RB Global replicating Copart’s owned-real-estate footprint or rebuilding twenty-three years of insurer claims integration. A share shift inside the duopoly does not change which company owns the underlying infrastructure. It changes which auction captures the next marginal car.
The Numbers: A Record Year And A Difficult Quarter
Fiscal 2025, which ended in July 2025, was a record year.
Total revenue: $4.65 billion
Net income: $1.55 billion, up 13.9% year-over-year
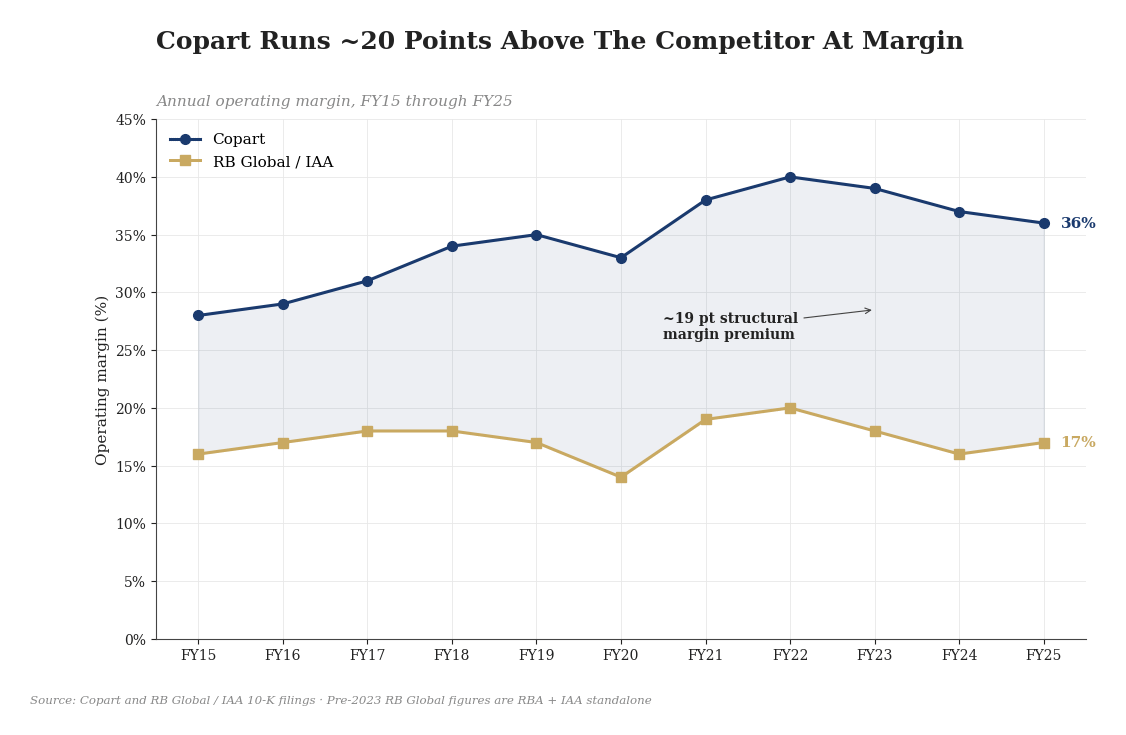
Operating margin: 36%
Free cash flow: $1.26 billion, up 28%
Operating cash flow: $1.8 billion, up 22%
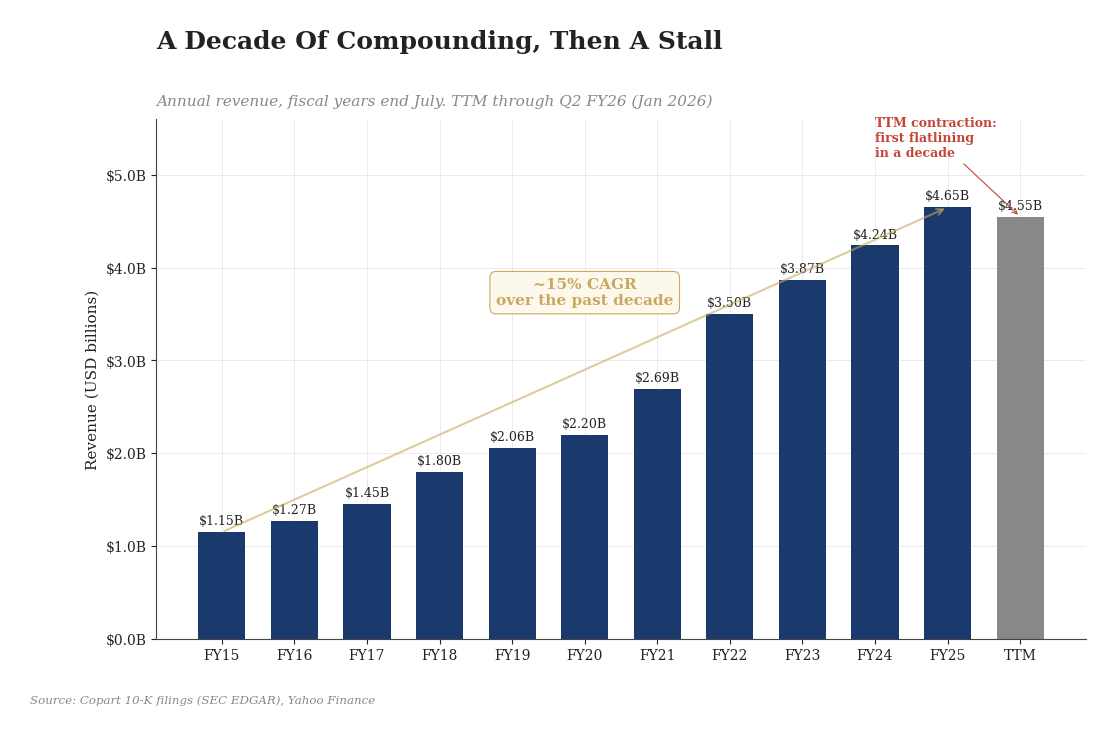
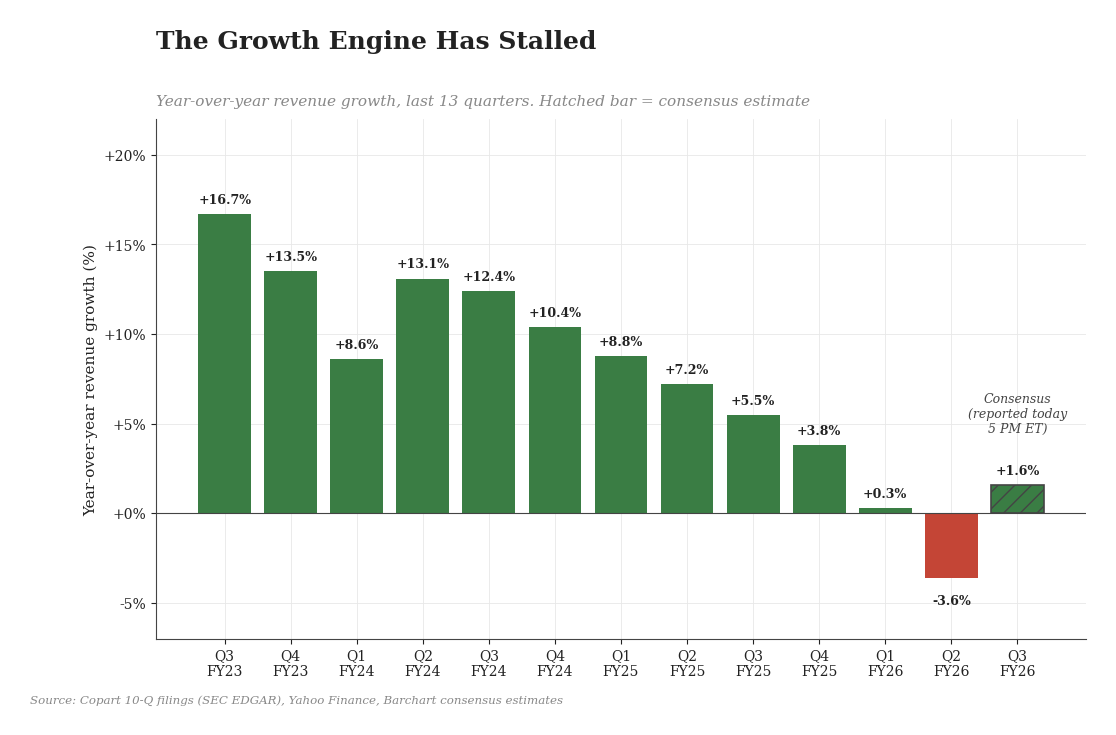
The long-run revenue trajectory has compounded at roughly 15% per year over the past decade. The most recent four quarters have flattened that trajectory meaningfully. Q1 fiscal 2026 revenue was roughly flat year-over-year. Q2 contracted 3.6%. The Q3 consensus calls for 1.6% growth, which would be a tentative bottoming if the print clears the bar.
Copart’s growth engine has stalled for the first time in a decade. Today’s print is the first read on whether the bottom is forming.
[Quarterly year-over-year revenue growth rate, last twelve quarters. Shows the deceleration from 15-20% growth in fiscal 2022-2023 toward zero in fiscal 2026.]
Operating margin has compressed alongside the volume contraction. Fiscal 2023 operating margin: 39%. Fiscal 2024: 37%. Fiscal 2025: 36%. Q2 fiscal 2026 saw further compression as fixed-cost absorption deteriorated. The fixed-cost base of 200-plus owned yards does not flex down when volume contracts. At low-single-digit or negative growth, operating margin compresses toward the 30-32% range before stabilizing.
When volume slows, the cost of maintaining 200-plus parking lots does not slow with it. Profitability shrinks until volume returns.
The margin compression is the most pressing operational concern. It is also the area where the bull case lives or dies. If the volume bottom forms in the next two-to-three quarters and operating leverage reasserts on the way back up, margins recover toward the high-30s range. If volume stays flat or contracts for an extended period, margin can compress further.
Today’s call answers the question of whether the worst is behind the business or still ahead of it.
Return on invested capital has tracked margin compression. Copart historically generated ROIC in the high-20s to low-30s range. The recent peak was the high-20s in fiscal 2023, with gradual decline since.
Copart still earns more on every dollar of invested capital than most companies in the S&P 500. The return is lower than it was three years ago, not broken.
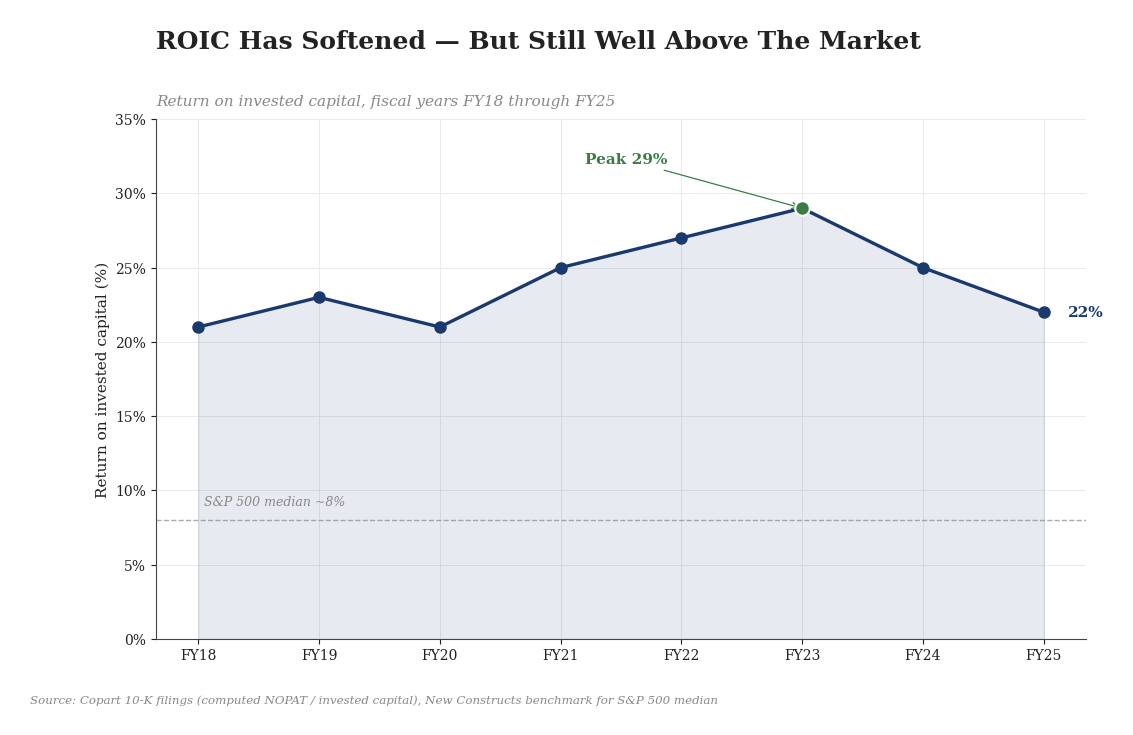
[Return on invested capital trend, fiscal 2018-2025. Shows the high-20s peak and the gradual softening.]
Free cash flow generation has been the part of the financial profile most insulated from the recent volume softness. Fiscal 2025 FCF of $1.26 billion ran up 28% year-over-year, partly because working capital released as the yards held less aging inventory than in the prior year. FCF conversion: 27% of revenue, or roughly 81% of net income.
Even in the weakest operating year of the past decade, the business is generating well over a billion dollars in real cash.
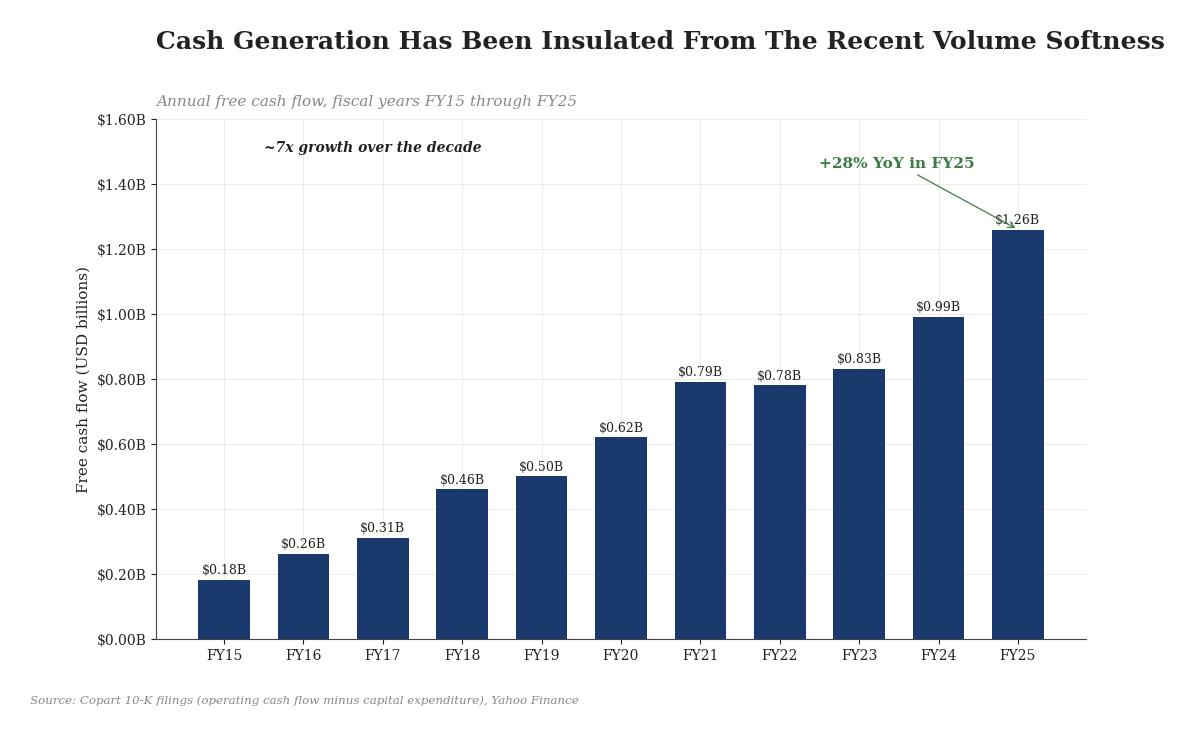
[Free cash flow growth, fiscal 2015 through fiscal 2025. Shows the long-run compounding alongside the operating expansion.]
The cash position exceeds total debt. The company funds its 18% year-over-year international growth from operating cash flow, not capital markets. The new $1.25 billion revolving credit facility announced in January 2026 expands optionality for capital deployment without forcing dependence on the equity markets.
Copart can keep funding its international expansion through a multi-year US slowdown without raising equity or taking on meaningful debt.
Management: The Founder Is Still On The Board

Founder Willis Johnson is still Chairman of the Board, more than two decades after the company’s IPO. Jay Adair served as CEO from 2010 through 2022 and continues as Executive Chairman. Jeff Liaw, the current CEO, joined Copart as CFO in 2016, was promoted to President in 2019, named CEO of North America in 2021, became Co-CEO with Adair in 2022, and stepped into the sole CEO role in April 2024.
That is a multi-decade succession arc with continuity at every layer. No external hire. No restructuring playbook. No “strategic pivot” into adjacent businesses. Liaw is the third operator in a continuous lineage that started with the founder, has spanned three decades, and has not once deviated from the core auction business model.
The pattern is what investors should want to see in a category killer of this kind. The companies that lose moats are the ones that bring in outside CEOs with three-year tenures and reorganization playbooks. The companies that keep moats are the ones with multi-decade insider continuity. Copart is in the second category.
The Catalyst: Why Every Smart Car Becomes Copart’s Inventory
The CCC Intelligent Solutions Crash Course 2026 report landed in March. The headline number: total-loss frequency in 2025 hit 23.1% of all auto claims, a new all-time high. Non-comprehensive total-loss rate hit 23.9%. The share of driveable vehicles declared total losses reached 10.4%, up from a multi-year baseline below 8%.
Underneath the headline number is the data point that matters more for Copart: ADAS calibrations now appear on 28.3% of all repairable appraisals, up from 21.8% last year. A 30% year-over-year increase in the share of repairs that require sensor recalibration.
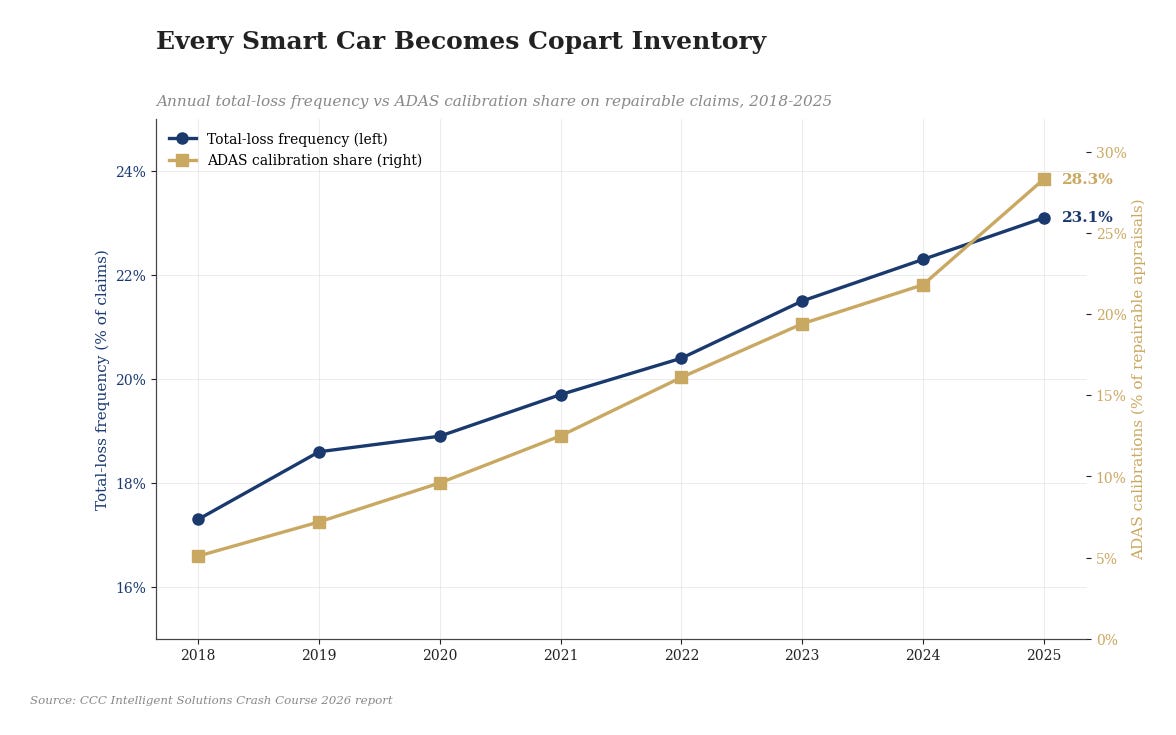
[Total-loss frequency by year, 2018-2025, with ADAS calibration share overlay. Source: CCC Crash Course 2026 report.]
The structural read on those two numbers together is straightforward. Modern vehicles carry more sensors than vehicles built five years ago. Every additional sensor adds another component that must be recalibrated after any meaningful collision. The combined effect pushes the per-vehicle cost of repair higher, while the per-vehicle market value of older cars stays roughly flat. More vehicles cross the threshold where repair cost exceeds resale value. Those vehicles become total losses. Those total losses flow into Copart and RB Global’s auction networks.
The structural tailwind has compounded for the past five years. It is accelerating, not decelerating. CCC’s reading of the underlying drivers (vehicle complexity, aging fleet, ADAS proliferation) suggests the trend continues as more ADAS-equipped vehicles age into the heavier-collision portion of the lifecycle.
This is the part of the story that makes the company interesting independent of the share dynamic. Both Copart and RB Global benefit from rising total-loss frequency. So who is positioned to flip more cars with the increased number of total cars caused by expensive sensors? The answer is Copart. Copart’s owned-yard footprint gives it more capacity than RB Global.
Q3 Earnings are released today, Thursday, May 21 at 5:00 PM Eastern. Consensus is for revenue of $1.23 billion, up 1.6% year-over-year, a meaningful recovery from the 3.6% contraction in Q2. EPS consensus is $0.42, flat year-over-year.
Three things to watch in the call:
US unit volume trend: Q1 fiscal 2026 was roughly flat, Q2 was -2.8%. A return toward flat or modest growth signals a bottom may be forming. A second consecutive negative print signals the Progressive shift has accelerated.
International revenue growth: ran at 18% year-over-year in Q3 fiscal 2025. A continuation at that pace would confirm the European and Middle East expansion thesis. A meaningful deceleration would compress the bull case.
Management commentary on the ADAS-driven mix: any quantification of how much of recent volume growth is structural (more total losses per claim) versus cyclical (insurance market dynamics) helps calibrate the long-run trajectory.
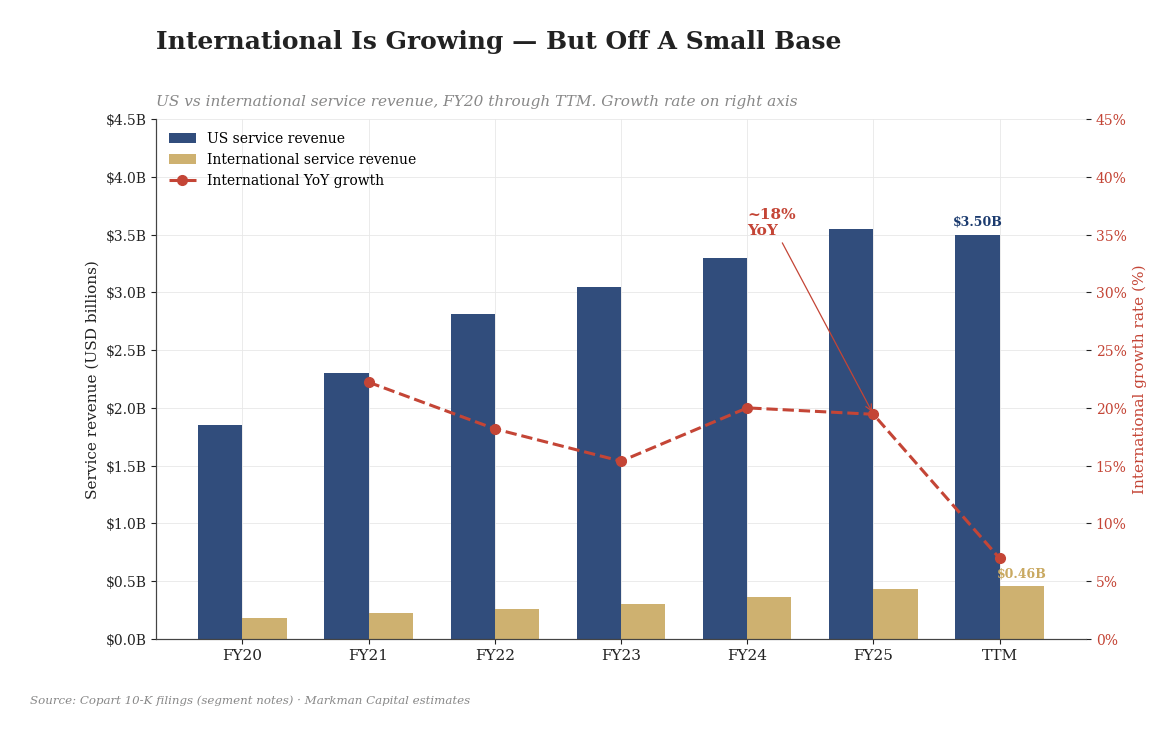
[International segment revenue and growth rate, fiscal 2020 through trailing twelve months, alongside US segment revenue and growth rate for comparison.]
Killing The Thesis: Six Ways Copart Loses
Six bear cases, in order of seriousness. Each is real. Each deserves to sit honestly in the analysis.
The duopoly has narrowed faster than the bulls expected. RB Global’s IAA integration is now in its first “clean year” since the 2023 acquisition. The integration synergies are starting to flow. The year-over-year unit growth differential is +4.7% RB Global versus -2.8% Copart. If that differential persists for another four quarters, Copart’s US share drops from ~50% to ~46% while RB Global’s climbs from ~35% to ~40%. The gap shrinks meaningfully. The pricing power that the duopoly structure preserves starts to erode.
Progressive’s volume shift is a leading indicator, not a one-off. The largest US auto insurers have been signaling for years that they want multi-carrier salvage workflows to avoid single-vendor dependency. If Progressive’s move is the first of three or four large carriers making the same call over the next 24 months, Copart’s share of insurer-driven volume could decline by single-digit percentage points across a multi-year window. That is meaningful operating leverage compressed against fixed real-estate costs.
2026 is the first contraction Copart has experienced since we have recommended that stock. Past compounders have shown one-year contractions and recovered. But not every compounder recovers cleanly. While we have few losses across the 70 stocks in Compound & Conquer, there are a few. Generally the structural read on those losses is that the moat thesis was right at entry and the moat broke under conditions that were not visible at entry. Copart could be in the early innings of the same dynamic. But it is too early to tell. We are tracking it here for posterity.
Operating margin compression has structural floor risk. The 36-37% operating margin range Copart has run at for the past several years assumes volume growth in the high single digits or better. At low single digits or negative growth, margin compresses meaningfully. The fixed-cost base of 200-plus owned yards does not flex. If volume stays flat for an extended period, margin can compress to the 30-32% range before stabilizing. That is a roughly 15-20% earnings haircut at constant revenue.
The international growth is real but small. Copart’s international segment is growing 18% year-over-year, which is impressive. But it is on a base small enough that even at that growth rate it does not offset US contraction in the near term. The international story is a three-to-five-year runway, not a 2026 fix.
The autonomous-driving long-tail risk is real and underweighted. Most coverage dismisses it as too far away to matter. The honest read is that level-4 robotaxi penetration in the US fleet is currently below 1% and will likely remain in single digits through the end of the decade. But every year past 2030 in which autonomous penetration climbs is a year in which total-loss volume per vehicle-mile-traveled probably declines, since autonomous vehicles are designed to avoid the collisions that produce totals. The structural read on a 2040 horizon is that the salvage auction industry will be smaller than today. Whether that is a tomorrow problem or a fifteen-years-away problem is the question. Copart’s owned-real-estate footprint is the kind of asset that retains optionality if the volume mix shifts. The question is whether the asset is worth as much in a smaller market.
None of those concerns invalidates the position today. All of them deserve to sit honestly in the analysis. The current price is $33.05. The 151% return earned since the 2018 entry has given back some ground in the past year. The structural moat is narrower than it was twelve months ago. It is also still meaningfully wider than any of the alternatives any insurer or buyer can switch to in less than three years.
Conclusion: The Quiet Business That Owns The Dirt

Hendrik Bessembinder’s 2018 study found that just 4% of US stocks created all of the net wealth in the US stock market between 1926 and 2016. The other 96% collectively underperformed Treasury bills. To put this plainly, most stocks suck. The wealth gets concentrated in a small handful of compounders that own structural advantages and reinvest patiently for decades.
The companies that produce that compounding share a profile. They are usually boring. They usually operate in markets investors have not thought about closely. They usually own physical assets and integrations that took decades to build and would cost tens of billions to replicate. They are usually not the names on the front page of the financial press in any given quarter.
Copart is one of them. The Copart of 2026 has less US share than the Copart of 2024. It has the same owned-real-estate footprint, the same twenty-three-year virtual auction infrastructure, the same insurer integrations, the same 750,000-buyer network, and a meaningfully larger international footprint than twelve months ago. The compounding has not stopped.
Companies that own the dirt, the tow trucks, the API integrations, and the buyer network at twenty-three years of accumulated scale do not lose those advantages in a single bad year. They lose them, when they lose them, the way Match Group lost its moat: through a slow erosion of the underlying engagement asset that the moat was wrapped around. Copart’s underlying asset is the structural conversion of damaged vehicles into auction inventory. As long as cars get more complex and more expensive to repair, that asset compounds.
The dirt is still there. The pipeline is still there. The buyer pool is still there. The market is growing internationally. The code is still there.
Some businesses you only have to build once.
Do not chase Copart before earnings.
Wait until Monday or Tuesday. Let the company report. Let the market throw its little tantrum. Wall Street always shoots first and reads later.
If the numbers are weak, we wait. We need to hear management’s plan. Risk comes first. Hope is not a strategy.
If the numbers are strong, then we can add. Clean numbers. Clear path. Fresh money.
My preference: add at market on Tuesday next week, after the dust settles. Money demands clarity.
Markman Capital Insight publishes research on category-killer compounders through the Compound & Conquer letter and on mega-cap platform companies through the Digital Creators & Consumers letter. Learn more at markmancapital.net.
Sources